Göteborg & Co
Understanding student needs and behaviors to guide Göteborg & Co’s communication strategy.
Client
Göteborg & Co
Year
2025
Time to read
3 minutes

Overview
The project
We were a team of six UX designers collaborating with Göteborg & Co, the organizers of the Science Festival. Our research focused on students aged 18–35 in vocational, college, and university programs within mathematics, IT and data, natural sciences, and engineering.
We explored whether they had participated in the festival before, what motivated them to attend, and if not, what barriers or reasons held them back. We also investigated their interests, among other things, to inform future engagement and communication strategies.
Industry
Public events
My role
UX research
Project type
Team project
Duration
3 weeks
Phase one
Designing the survey
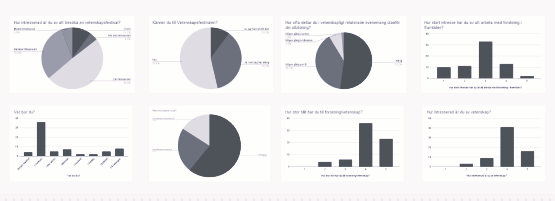
We designed the survey in Google Forms with carefully structured questions. To ensure that the responses came from the correct target group, we included screening questions at the beginning. The survey also provided clear information about data collection and how the responses would be used.
In total, we collected 76 survey responses, of which 69 fell within our target group. The survey also included participants older than 35, as we aimed to support colleagues who were researching different age groups.
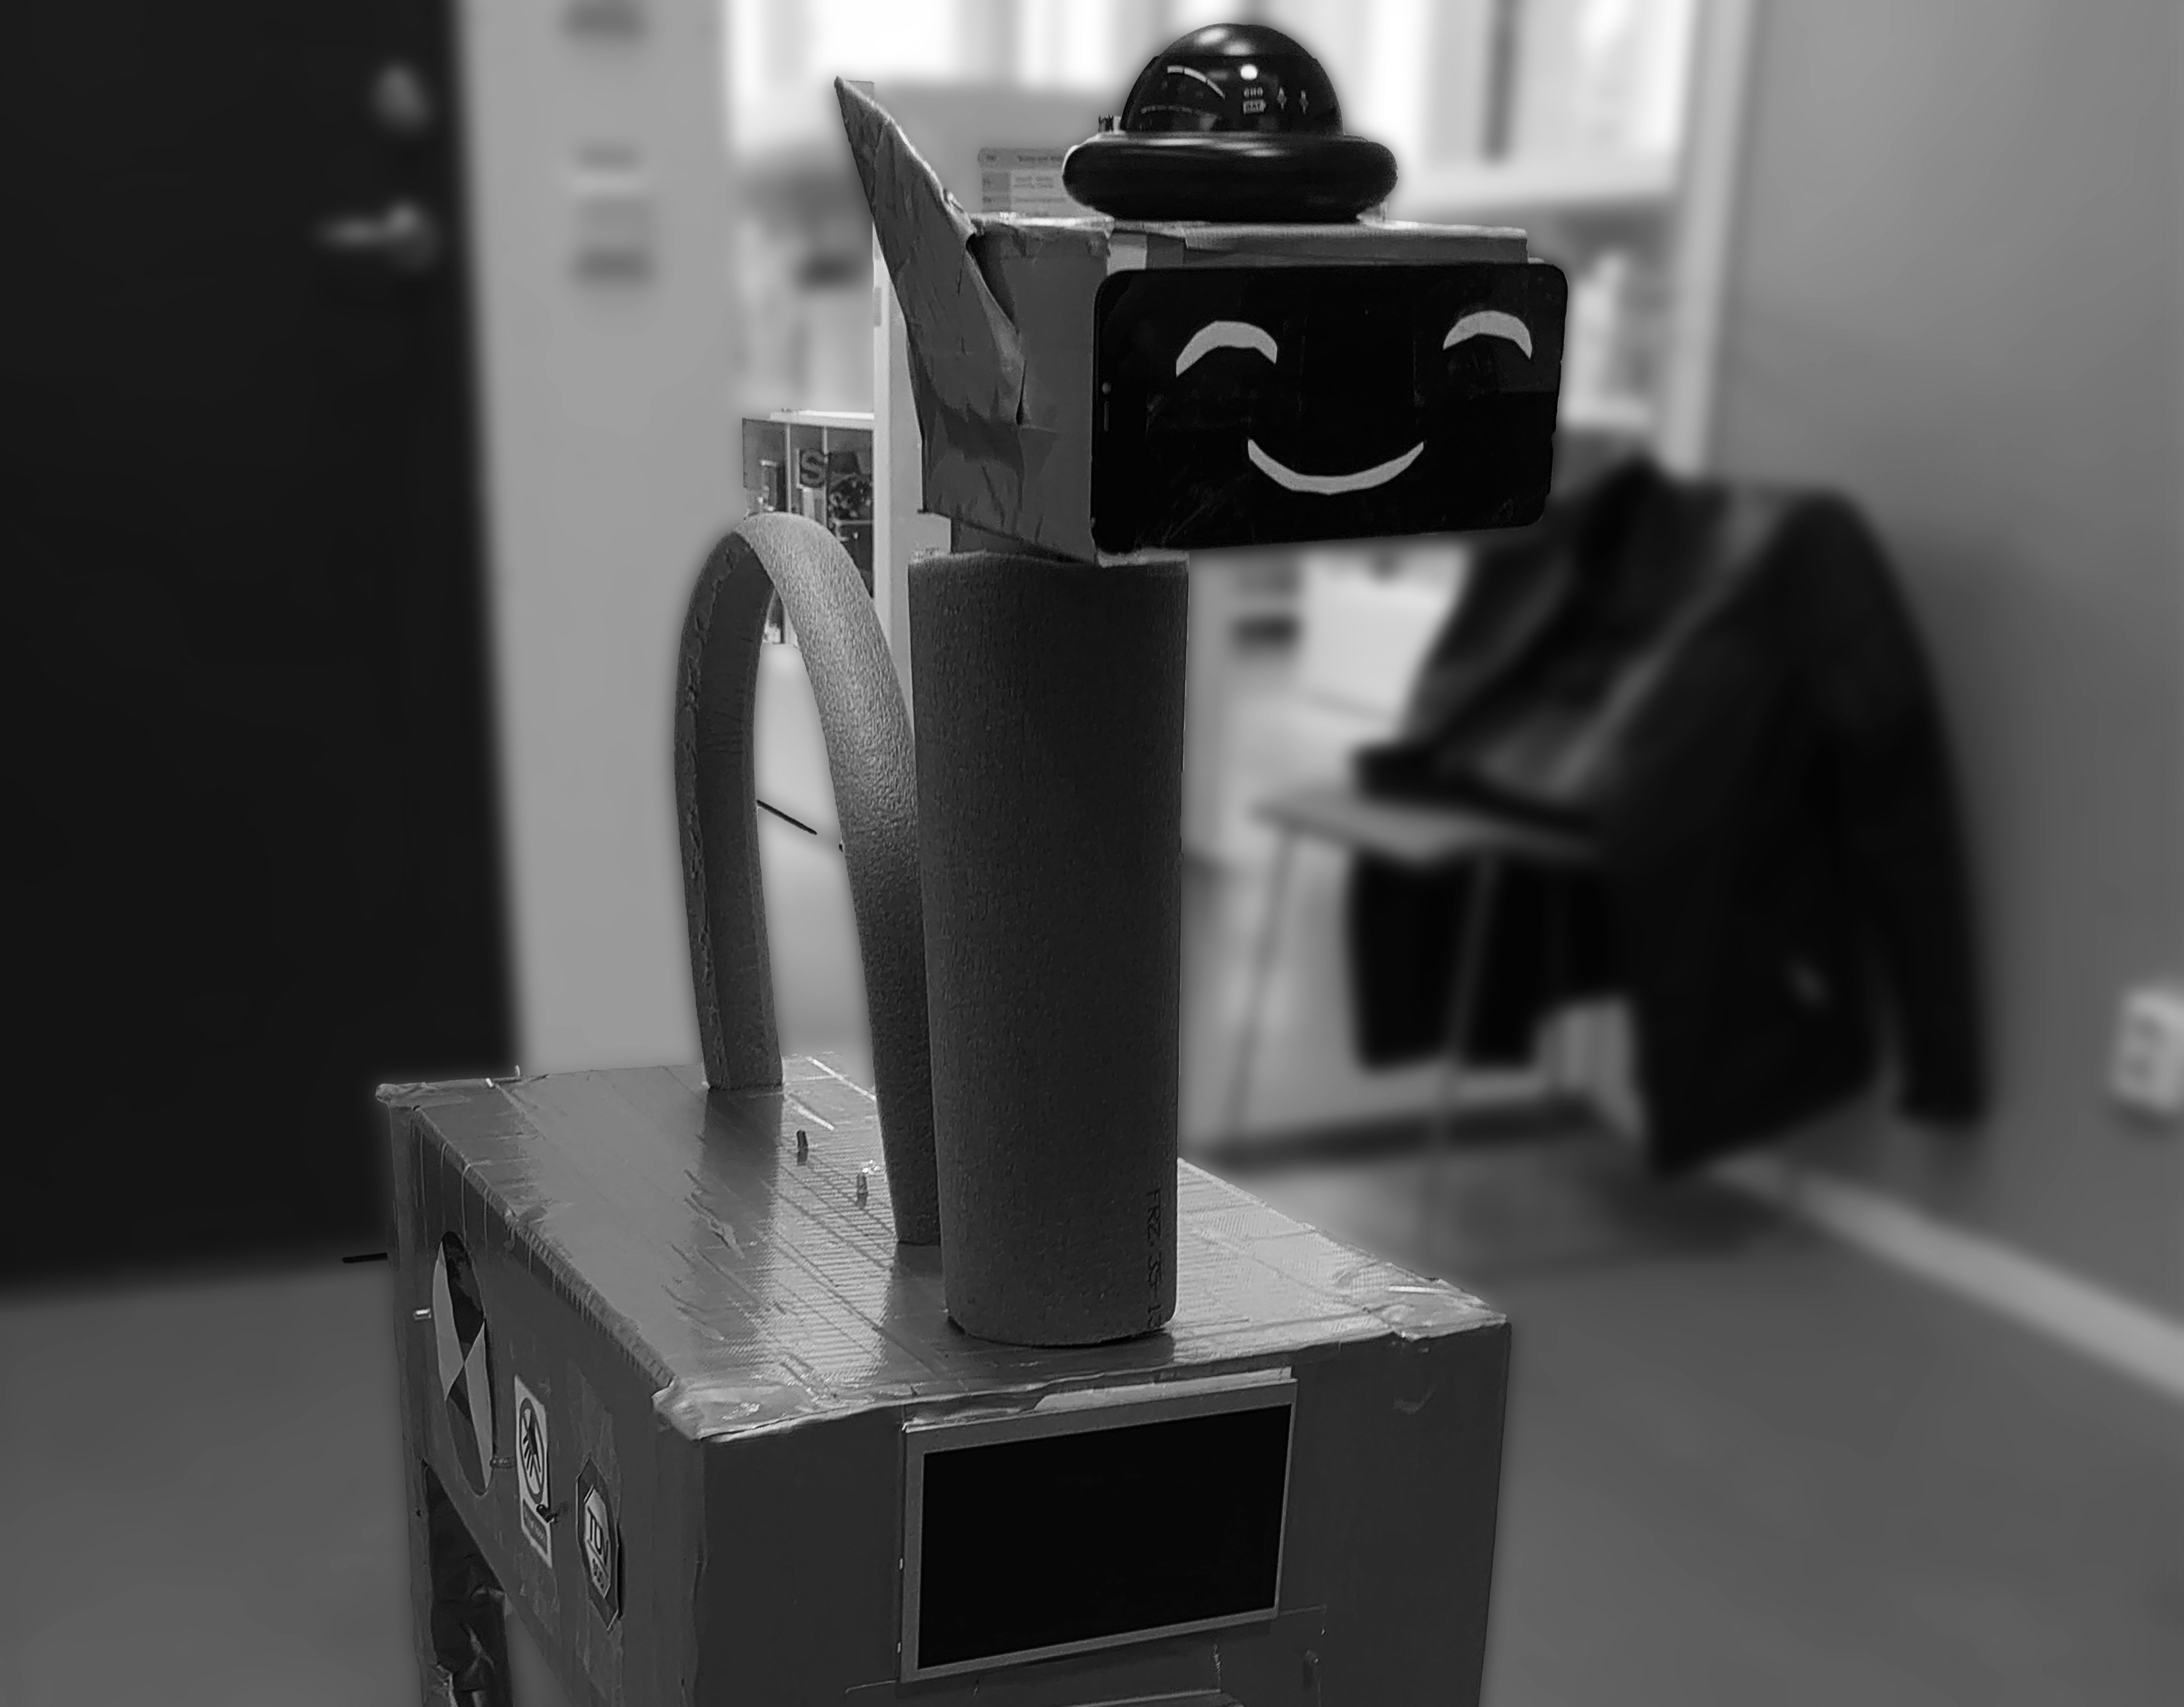
Final version of the Fetchbot prototype in the test room, ready for testing.
Phase two
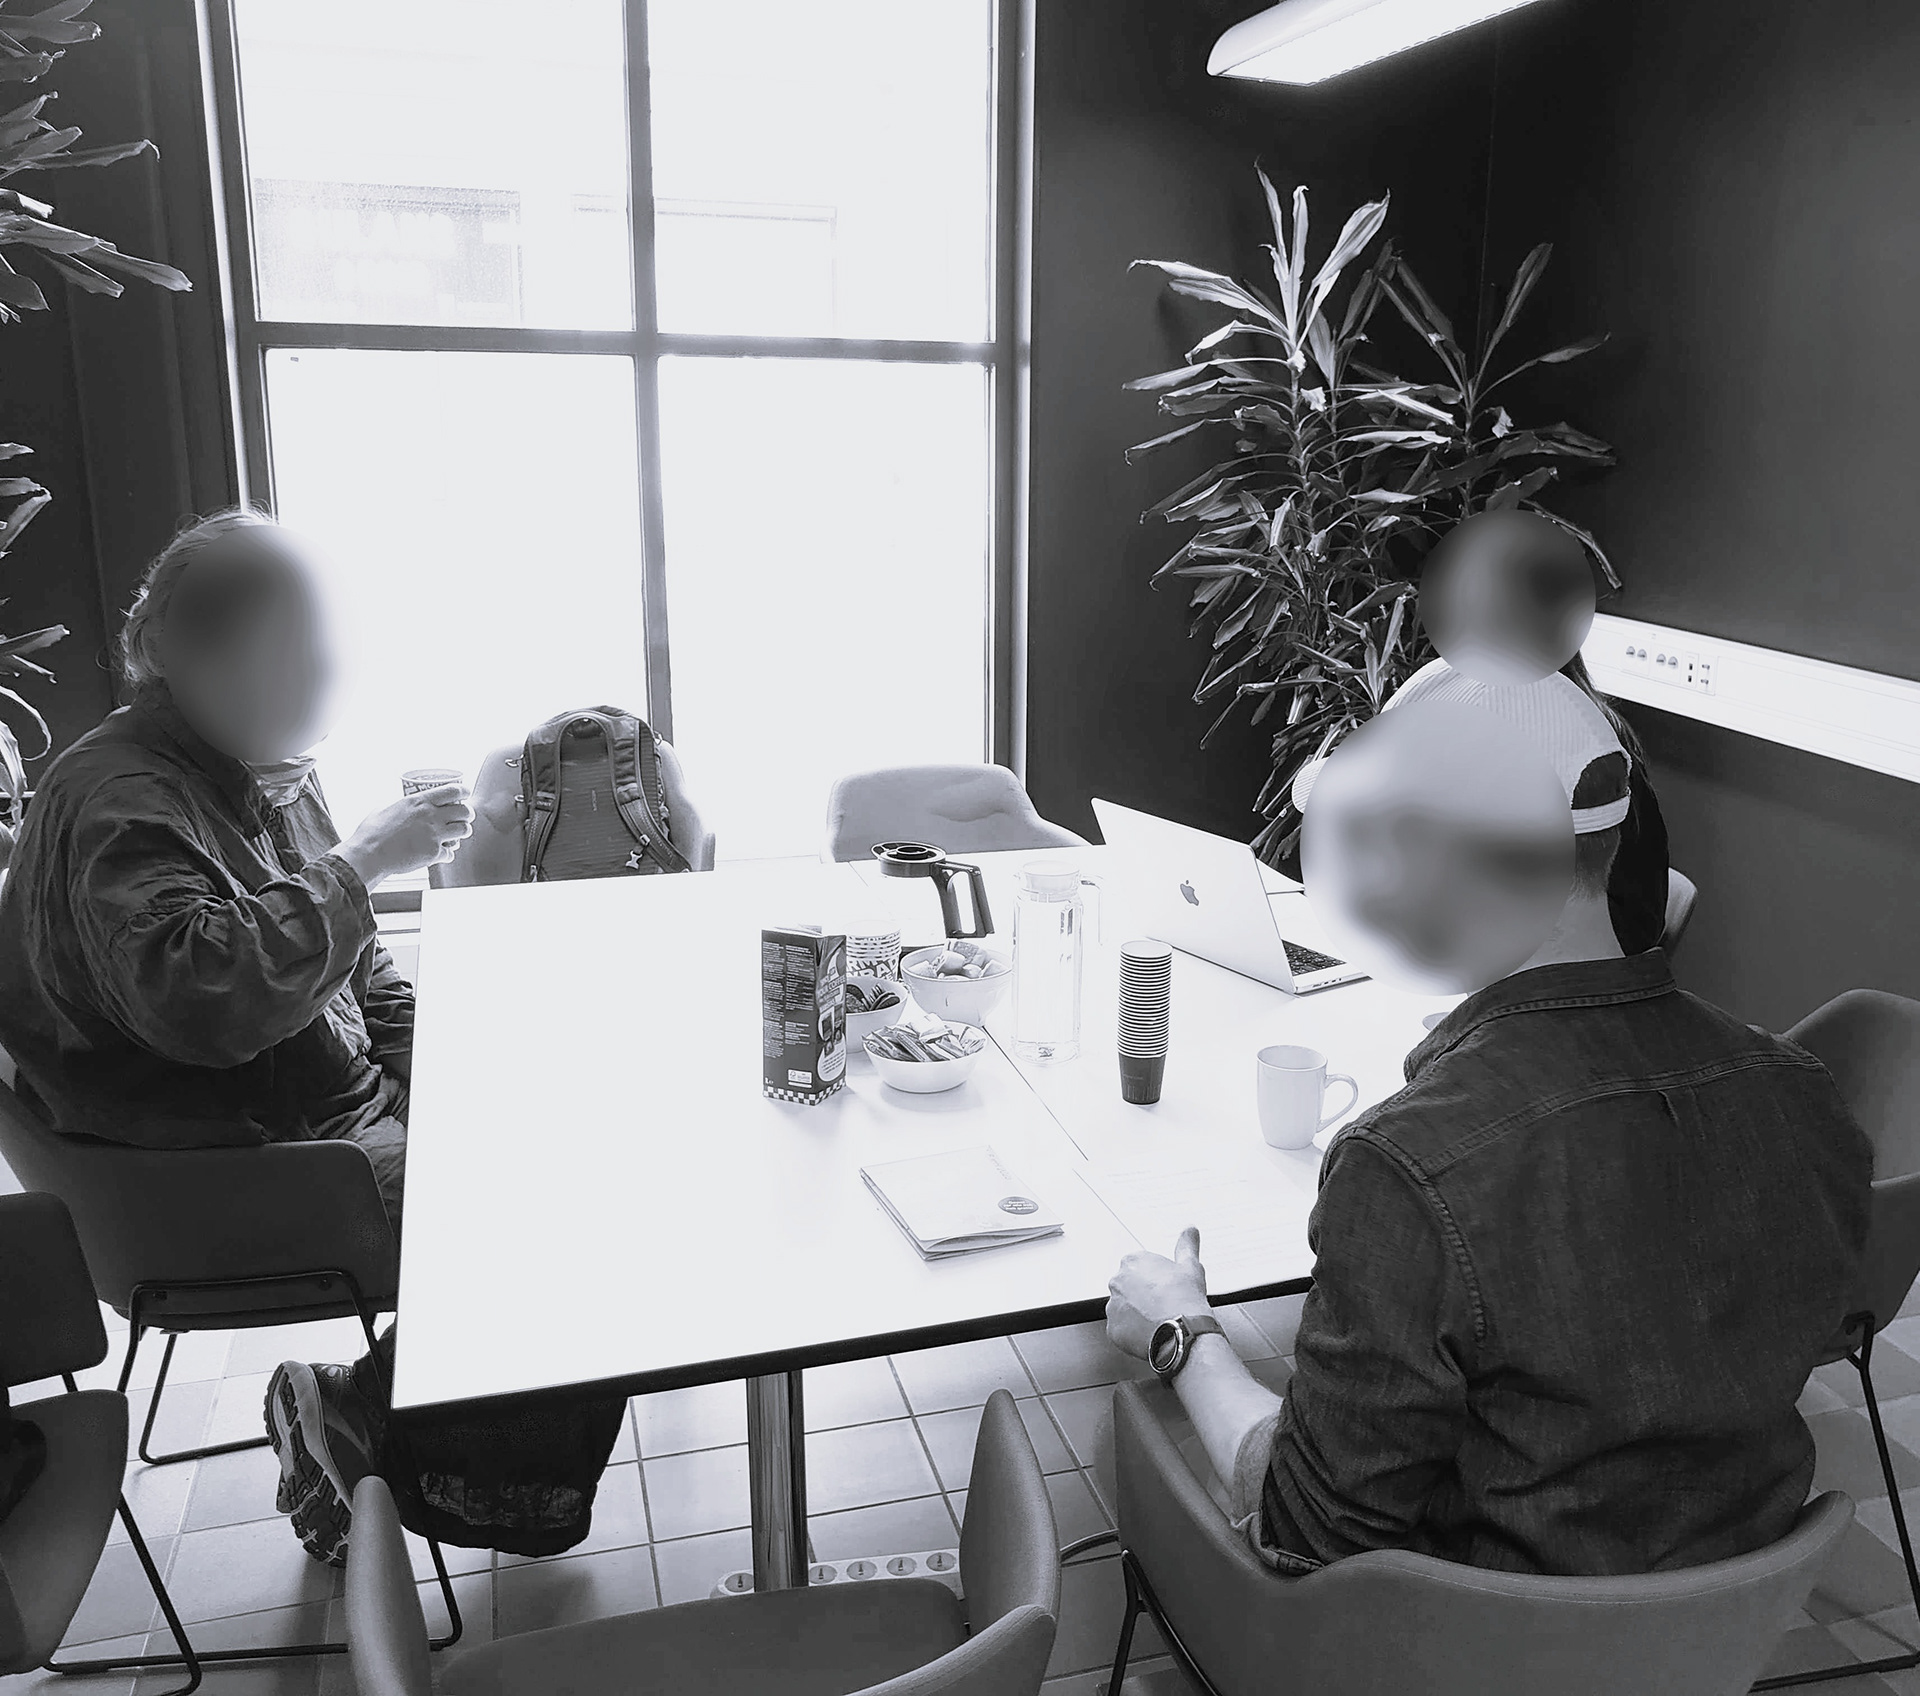
Conducting 1:1 interviews
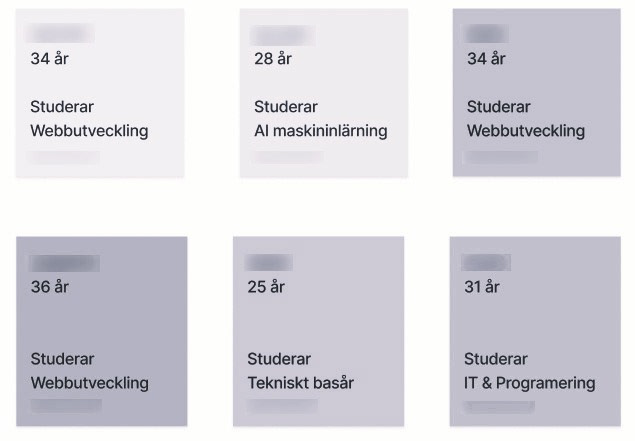
In total, we conducted six 1:1 interviews with participants from our target group. I personally interviewed two of them one remotely and one in person and also took on the role of observer and note taker during one of the other interview sessions.
We used a semi‑structured interview format, and the questions were open ended to avoid yes or no answers as much as possible. This allowed participants to share richer insights and describe their experiences in their own words.
Phase three
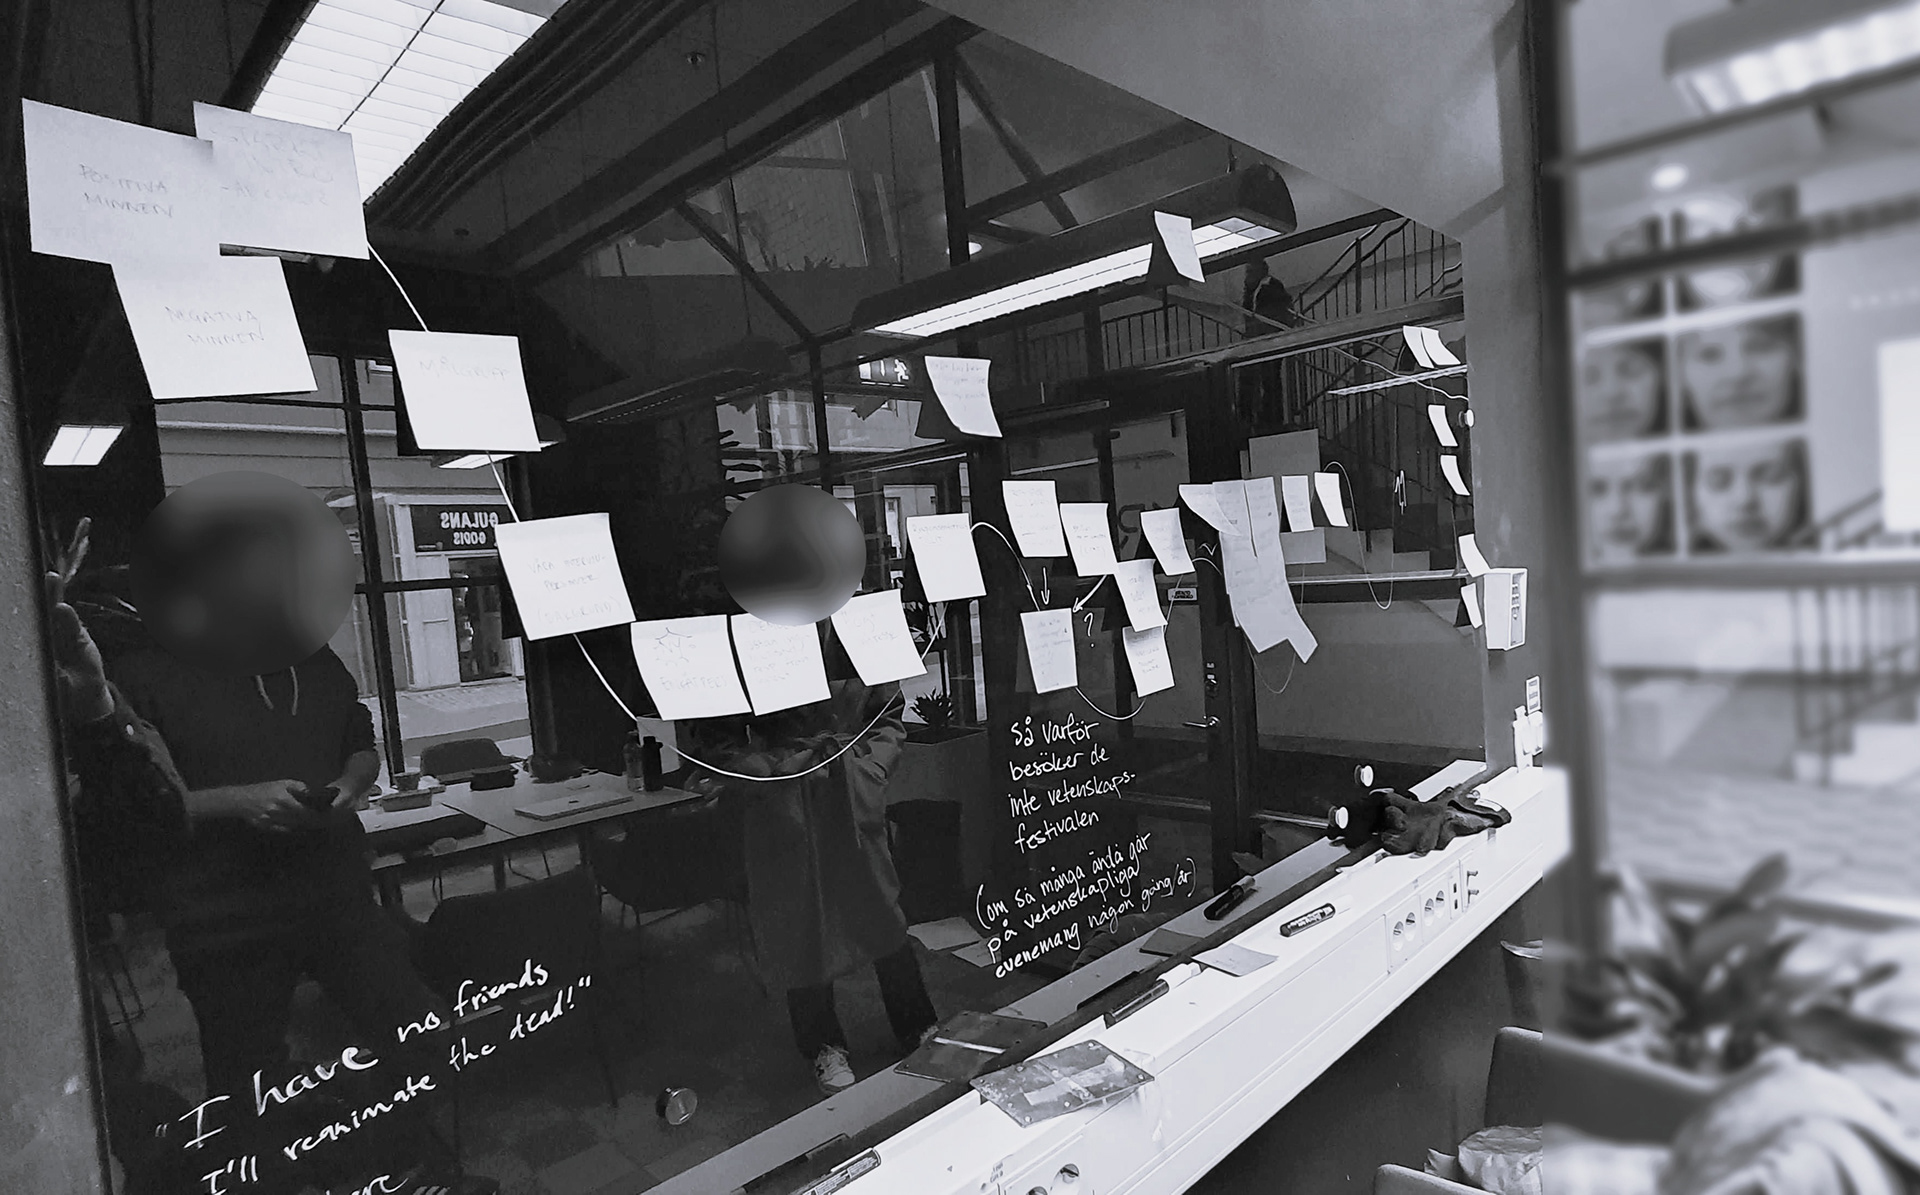
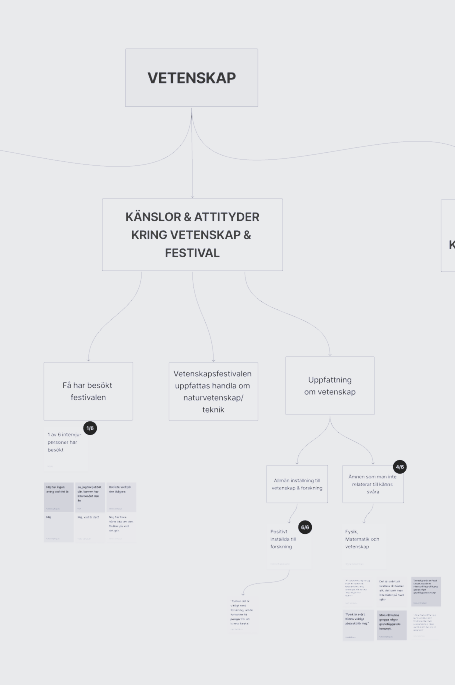
Analyzing the data
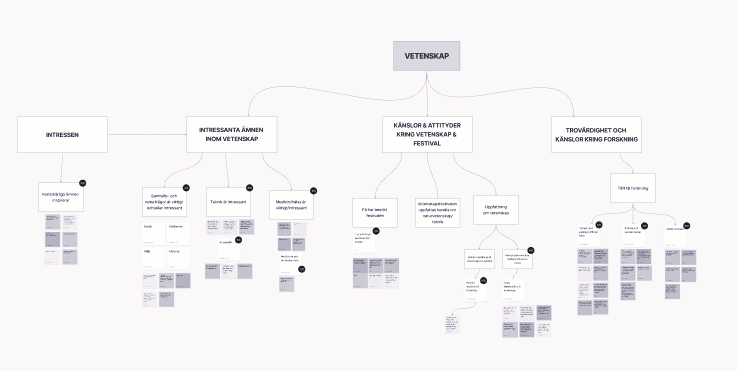
Analyzing the survey data was straightforward thanks to Google Forms, but we still needed to interpret the open‑ended responses, categorize them in Google Sheets, and transfer everything to Miro. This helped us compare the survey results with the interview insights and spot shared patterns.
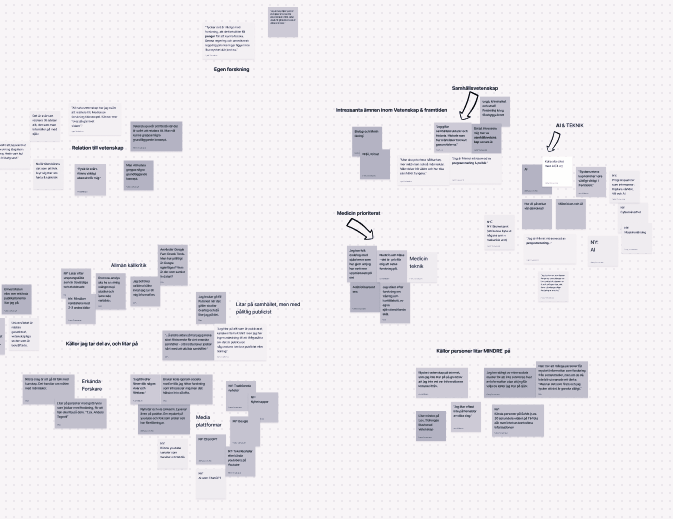
For the interview data, we gave each participant a unique Post‑it color in Miro and coded their answers accordingly, making it easy to trace insights back to each person. We then grouped the responses repeatedly, narrowing the themes until no further refinement was possible.

Inside the workflow
Wanna know more detail?
Schedule a call with calendly.
Explore other projects