0:00/1:34

Göteborg & Co: User Research

Understanding student needs and behaviors to guide Göteborg & Co’s communication strategy.

Industry

Events

Role

UX researcher

Project Type

Team Project

Duration

4 weeks

a cellphone leaning against a wall

Stage 1. Designing the survey

  • We designed the survey in Google Forms with carefully structured questions. To ensure that the responses came from the correct target group, we included screening questions at the beginning. The survey also provided clear information about data collection and how the responses would be used.

    In total, we collected 76 survey responses, of which 69 fell within our target group. The survey also included participants older than 35, as we aimed to support colleagues who were researching different age groups.

Stage 2. Conducting 1:1 interviews

  • In total, we conducted six 1:1 interviews with participants from our target group. I personally interviewed two of them one remotely and one in person and also took on the role of observer and note taker during one of the other interview sessions.

    We used a semi‑structured interview format, and the questions were open ended to avoid yes or no answers as much as possible. This allowed participants to share richer insights and describe their experiences in their own words.

Stage 3. Analyzing the data

  • Analyzing the survey data was straightforward thanks to Google Forms, but we still needed to interpret the open‑ended responses, categorize them in Google Sheets, and transfer everything to Miro. This helped us compare the survey results with the interview insights and spot shared patterns.

    For the interview data, we gave each participant a unique Post‑it color in Miro and coded their answers accordingly, making it easy to trace insights back to each person. We then grouped the responses repeatedly, narrowing the themes until no further refinement was possible.


a cellphone leaning against a wall
a cell phone on a rock

Final Stage . What we found out

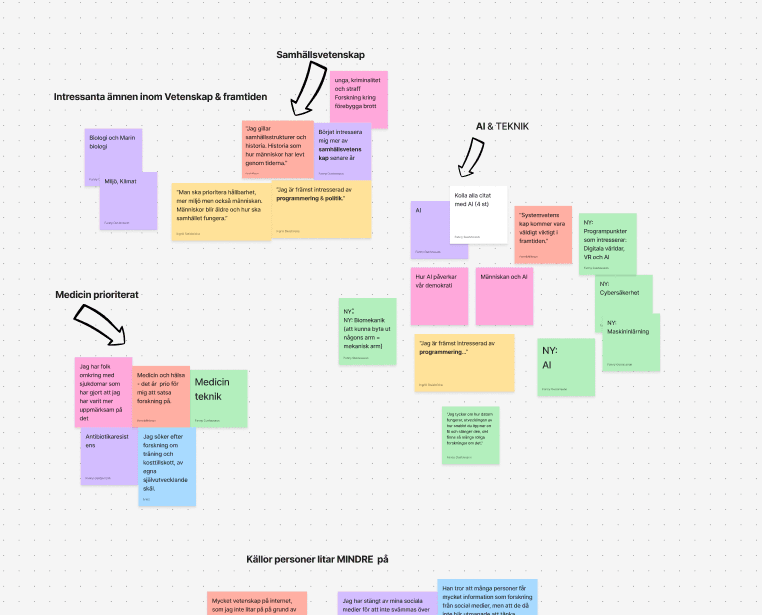
  • We discovered that only eight participants from both the interviews and surveys had actually visited the festival. This is mainly because most people didn’t even know the festival existed. Many people chose not to attend due to accessibility issues and uninspiring lecture rooms. 

    Our research also shows that visitors prefer engaging experiences over traditional lectures, as well as the opportunity to eat and drink during different sessions.


a cell phone on a ledge
a cell phone on a table
a cell phone on a bench

Takeaways

During this project, I learned how to conduct user interviews more effectively. I realized how important it is to come prepared and show up as a real, approachable human so participants feel comfortable. I also gained a clearer understanding of how to analyze interview data in a structured way that actually leads to meaningful insights.

Other projects

Connect with me

Let’s talk projects, collaborations, or anything UX related!

Connect with me

Let’s talk projects, collaborations, or anything UX related!

Connect with me

Let’s talk projects, collaborations, or anything UX related!

Copyright 2026 Sarwat Ghalib

Copyright 2026 Sarwat Ghalib

Copyright 2026 Sarwat Ghalib